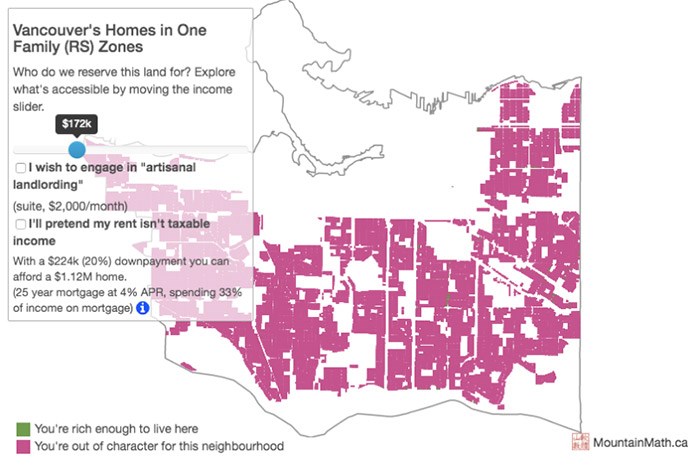
 Mountain Math lets homebuyers use a slider to turn the pink (canât afford) areas into green (can afford) areas based on your family income. Photograph By Mountain Math/Jens von Bergmann
An created by Vancouver-based data analytics company Mountain Math shows that even above-average incomes are not enough to afford a single-family home in Vancouver.
The map lets users input their yearly household income on a sliding scale, which allows the map to highlight in green the homes users are ârich enoughâ to afford in Vancouver. The map displays homes that are âout of characterâ for the inputted income bracket in pink.
The Mountain Math map assumes that users have saved up a 20 per cent down payment and are willing to spend 33 per cent of their pre-tax income on the homeâs mortgage. It does not allow for calculations using larger down payments, which are typical when trading single-family homes. The mortgage used is for 25 years at 4 per cent interest, which is higher than the average 2.94 per cent fixed rate.
The map shows that the majority of single-family homes in Â鶹´«Ã½Ó³»are out of reach for all but the very wealthy. The minimum income required for the map to turn anything other than completely pink is $170k. At $250k, most homes on Vancouverâs East Side are green, but most West Side homes remain pink even at this high income level. According to the latest census data on Statistics Canada, the median household income in Â鶹´«Ã½Ó³»was $79,930 for 2015.
âExcluding me and so many other Vancouverites from the vast majority of residential land is something that I think needs to change,â said Jens von Bergmann, co-founder of Mountain Math and creator of the map, to Metro News.
Read more from


