As we continue to adapt to the extraordinary changes brought upon our daily lives by the COVID-19 pandemic, it is worth stepping back every now and then to examine the mounting data associated with the virus’ impact on British Columbia.
The recent “modelling” released by Provincial Health Officer Bonnie Henry is fascinating on many levels. The charts and tables tell us where the virus came from, where it has been, where it is now and how our own personal behaviours have changed since the pandemic began.
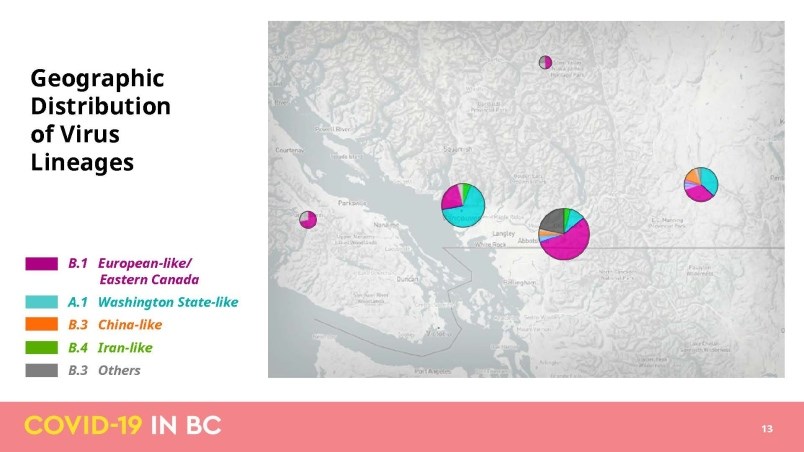
For example, the “genomic epidemiology” of some strains of the virus suggests COVID-19 began its entry to B.C. via a relatively small number of travellers from China and Iran. However, travellers first from Washington and then, by much greater number, travellers from Europe and Eastern Canada quickly overwhelmed those numbers.
Dr. Henry and Health Minister Adrian Dix have been reluctant to offer many specifics about the geographic location of COVID-19 cases that have tested positive for the virus, other than assigning them to the rather large, multi-community health authorities.
But the modelling provides a glimpse of which areas have had the most cases (or the least) and how that has changed over the past few months.
For example, it has become apparent in recent weeks through the daily posting of overnight case numbers that the virus seemed to be particularly prevalent in the Fraser Health authority to a greater degree than any other authority.
The modelling underscores this view. A comparison of total cases throughout the pandemic to the cases discovered in the last two weeks of May suggest the virus is now most prevalent in the eastern part of the Fraser Health authority (i.e. Abbotsford, Chilliwack, Hope etc.) and the southern part (i.e. Surrey, Delta, Langley etc.).
During the last two weeks of May, there was just a single case in North Â鶹´«Ã½Ó³»(where, during the course of pandemic there have been 259 cases) and only 13 in Vancouver. Richmond had zero cases, and Burnaby, New Westminster and the Tri-Cities had just 10 cases between them.
The rest of the province had almost no COVID-19 cases at all in that period (in fact, as of this writing there are zero cases in three health authorities: Â鶹´«Ã½Ó³»Island, Interior and Northern).
Meanwhile, Fraser Health south had 57 cases and Fraser Health east had 48 cases. That is about 75 per cent of all B.C. COVID-19 cases in that period and it has been that way for weeks now.
The two regions have just 34 per cent of all cases, so it appears as the virus dissipates in other areas it continues to have a stronger presence in the Fraser Valley.
There are other tidbits from the modelling. Contact tracing shows an average person had regular contact with about 11 people in our social bubble before health restrictions were enacted, and now that seems to be down to around four.
In addition, it shows a bit of good news: retail shopping, recreation and transit are ever so slowly coming back after a near 50 per cent drop in those activities the past few months. And visits to parks have skyrocketed.
Clearly, the public health measures that have been enacted are having a positive impact. We are slowly re-opening but the model suggests that too great of an expansion in our personal contacts can cause COVID-19 cases to spike very quickly.
So keep your distance and keep washing those hands!
Keith Baldrey is chief political reporter for Global BC. [email protected]


