Human-caused climate change boosted temperatures for roughly half the planet’s population this summer, with British Columbia among one of the hardest hit regions, a new analysis has found.
The , from the U.S. research group Climate Central, pulled data from its global Climate Shift Index (CSI), a tool built on a peer-reviewed process to model two temperature scenarios — a counterfactual world where humanity never burned fossil fuels and reality.
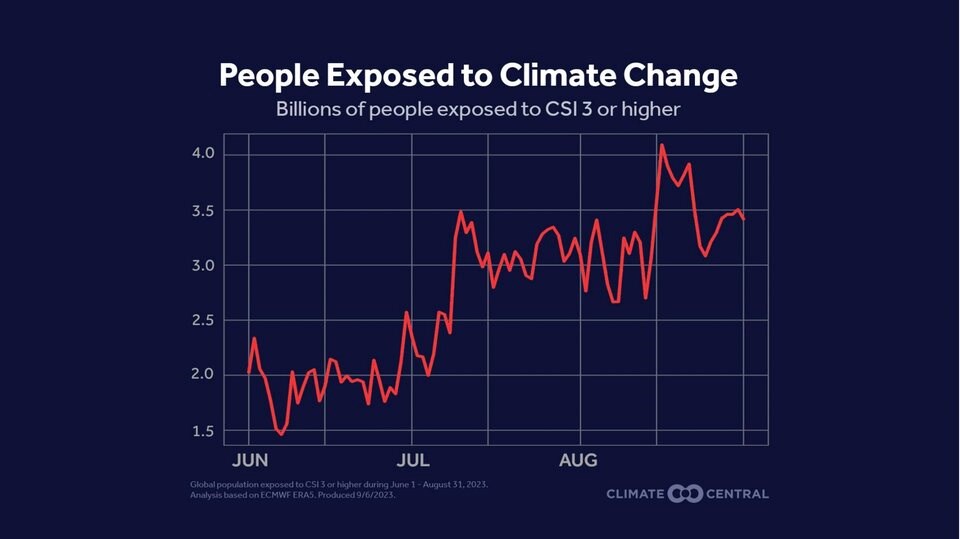
Between June and August, just under eight billion people, or 98 per cent of the entire human population, experienced temperatures made at least twice as likely by the heat-trapping effects of carbon pollution. Nearly half the world’s population lived through 30 or more days of temperatures made at least three times more likely due to carbon pollution this summer, according to Climate Central.
And in extreme but not uncommon cases, the group’s analysis also found that 2.4 billion people on the planet experienced more than 60 days where temperatures were made more than five times more likely due to carbon pollution, according to the analysis.
“Virtually no one on Earth escaped the influence of global warming during the past three months,” said Andrew Pershing, the group’s director of climate science.
“One of the big lessons from this summer is just that there's no break and there's no escape.”

A daily look at climate's influence on local temperatures
As a public-facing rapid attribution tool, the CSI presents an ever-changing heat map of the planet, shaded with a five-step scale. At zero, the influence of climate change on weather conditions, such as a daily high or low temperature, is not detectable. At this point on the scale, the prevailing weather is as likely to proceed with or without the effects of climate change.
A CSI of +1 indicates climate change has made weather 1.5 times as likely; at +2, a strong effect from climate change has made weather twice as likely; at +3, a very strong climate fingerprint has made the prevailing weather three times as likely; and at +4, weather conditions have been made four times as likely, or “extremely rare without climate change.”
At +5, an “exceptional” climate change signal indicates weather conditions have been made at least five times more likely, “potentially far more,” states Climate Central’s CSI scale.
“It’s similar to the strategy for weather forecasts — your weather forecast has not been peer-reviewed, but the models underlying it have been,” said Pershing.
Bernadette Woods Placky, a meteorologist and director of Climate Central's Climate Matters group, said their analysis does not include further warming due to the effects of El Niño — a climate-warming phenomenon that returns every few years in a natural cycle unconnected to human-caused warming.
“Even with El Niño, we're still seeing this massive push of temperatures,” she said.

​Beyond the CSI’s five-point scale, Pershing said more sophisticated statistics are required to make sense of the climate signal. That’s where World Weather Attribution (WWA) steps in.
Friederike Otto, a climate rapid attribution researcher at London’s Imperial College that works with WWA, pointed to a number of hot spots across the planet this summer: a heat wave in India made 30 times more likely due to climate change, one in Southeast Asia that would “basically not have occurred” were it not for humanity's carbon footprint.
And in Canada, Otto helped produce a rapid attribution study showing that the 2023 due to human-triggered climate shifts.
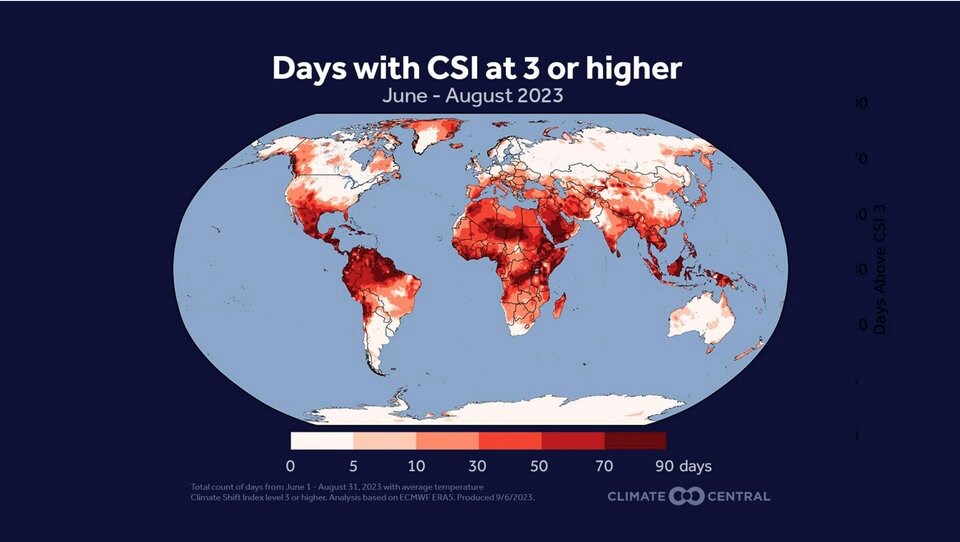
Some of the places hardest hit by climate-driven heat this summer were in Mexico and the U.S. south, Central and northern South America, Spain and Italy, and the Arabian Peninsula, Africa and Indonesia.
An intense climate warming signal was also found stretching across British Columbia, a province that saw on average 23.7 days of extreme temperatures made worse by climate change. Along B.C.’s coastal regions, temperatures were made at least three times more likely during upwards of 70 days between June 1 and Aug. 31 — a figure that puts the region among the planet's most influenced by climate-driven heat this summer.
“British Columbia has been one of these places around the world that has just had very persistent, unusual anomalies throughout this summer,” said Pershing.
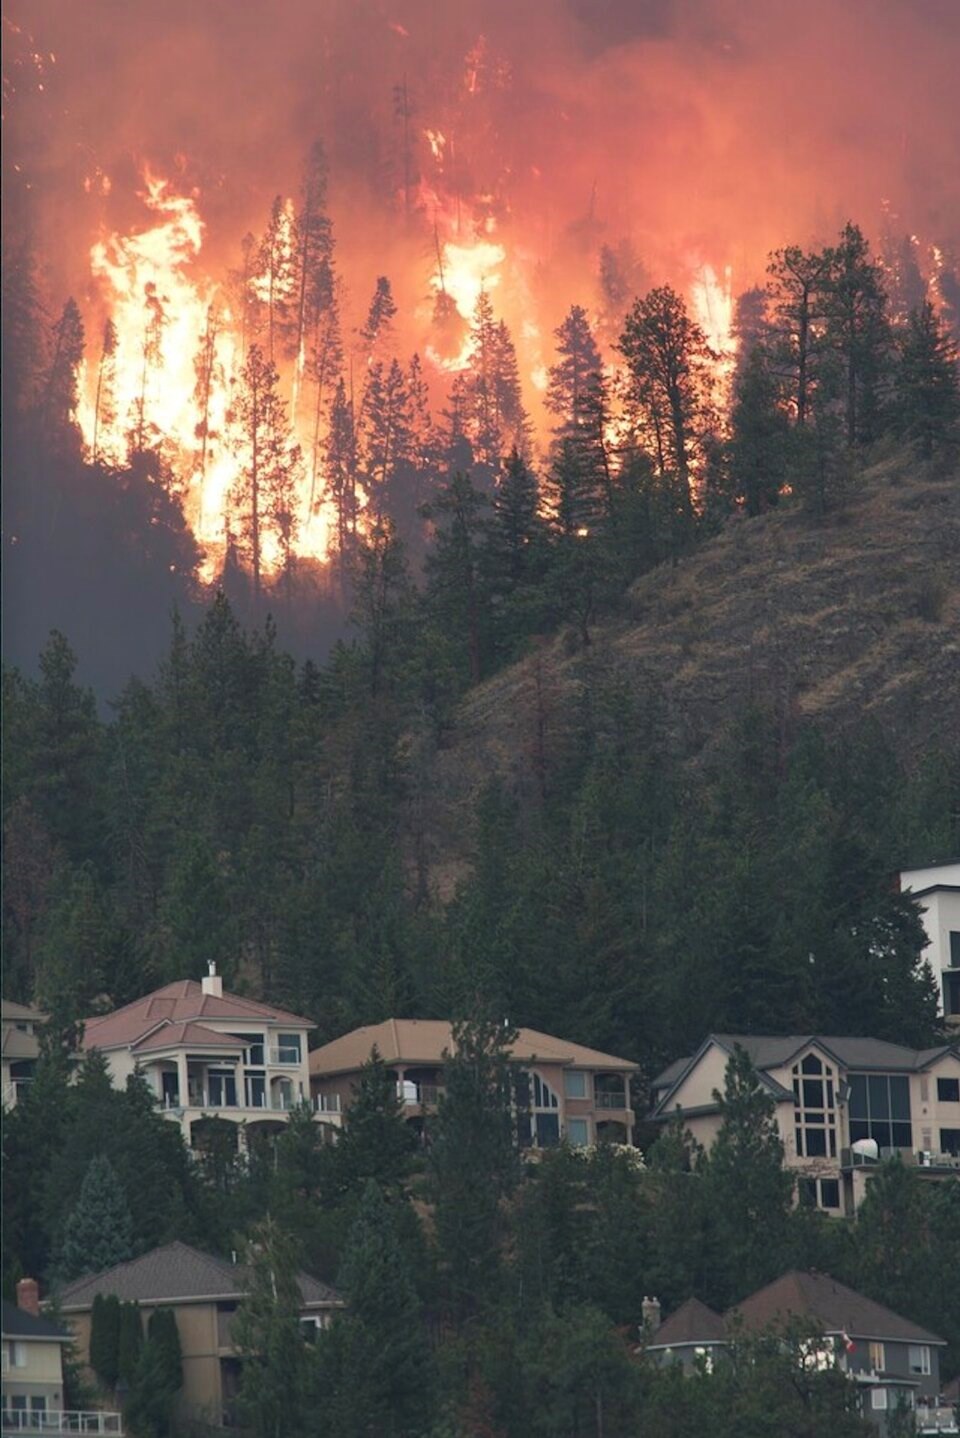
Across Canada, a record fire season has now devastated nearly 156,000 square kilometres of land, almost two-thirds of England, Scotland and Wales combined, and more than double that burned in 1989, the previous record.
In B.C., where fires tend to burn later into the fall, the province continues to set its own grim record, with wildfires so far having burned an area equal to about 60 per cent of Â鶹´«Ã½Ó³»Island.
On Wednesday, provincial Emergency Management Minister Bowinn Ma said that although “the end is near” for B.C.’s fire season, the "sleeping giant" in the season of natural disasters is drought. About 80 per cent of B.C. is currently under level four or five drought conditions, the two highest designations.

'So obvious now'
Otto said so many temperature anomalies were seen across the world, her team has had a hard time keeping up in one summer. In places like B.C., she and her colleagues are working to expand their analysis of extreme fire weather in Canada. But elsewhere in the world, there are many places where local records won’t allow for a full understanding of how bad the heat really was.
“Our societies have adapted to a very, very stable climate over hundreds of years, and so changing that is just something we are absolutely not prepared to deal with,” said Otto.
“There are strong limits to what we can adapt to.”
Otto added that across the world, those who are most vulnerable are paying the highest price, even though they have contributed the least to “the political landscape that favours fossil fuel extraction.”
“This is not going to stop until we stop burning fossil fuels,” Otto said. “No one can say climate change doesn't cost us anything or that the measures to keep the planet safe are more expensive than what we see here.”
“It’s just so obvious now.”


