Sea level rise maps meant to help people understand how future flooding could impact their lives may be backfiring, a new study has found.
The research, published in the peer-reviewed journal Nature Sustainability, honed in on how the maps — which use the latest scientific models to visualize future flooding — failed to change people's perception of risk in four U.S. states.
Matto Mildenberger, an associate professor of political science at the University of California, Santa Barbara and the study’s lead other, said the results offer lessons for Canadian coastal communities, and to the scientists and policymakers trying to inform the public of the dangers of climate change.
“These top down maps may be focusing people's attention on one small sliver of the problem, and a sliver that actually reduces the concern for climate change,” he said.
A Canadian originally from New Brunswick, in the past, Mildenberger spent time researching environmental issues in B.C. politics. More recently, his focus has been on how to effectively communicate climate and energy policies to the public.
Mildenberger says convincing the public to prepare for climate change hinges on what social psychologists call — an idea that proposes the human brain struggles to interpret events distant in time or space because it lacks the specifics to make that experience come to life.
Maps showing sea level rise have often been framed as a powerful tool governments and scientists can use to overcome that psychological barrier and convince a sometimes skeptic public that global warming presents a real risk.
Unfortunately, says Mildenberger, recent evidence shows they could be having the opposite effect.
Maps backfiring for both climate progressives and skeptics
Early evidence flood maps were not convincing the public of the dangers of sea level rise emerged in San Francisco. But Mildenberger said it wasn't clear what was going on and how widespread the backlash was outside the famously progressive Bay Area.
So Mildenberger and his colleagues recruited more than a 1,000 participants in coastal areas spanning San Francisco, Calif., Norfolk, Va., Ocean County, N.J., and Palm Beach, Fla.
The first two cities represented populations considered to have high to moderate acceptance that sea level rise is happening and is being triggered by climate change. Neither city had experienced a significant and recent “focusing event” to make that risk feel more real.
The communities on the New Jersey and Florida coasts, on the other hand, were considered less accepting of climate science. Both, however, had faced recent major flood events — Superstorm Sandy in Ocean County and nearly every hurricane season in Palm Beach.
Participants were chosen within a mile of a future flood boundary. Some were on the dry side. Others had homes low and close enough to the sea they are expected to be at least partially submerged beneath the waves by 2100.
Mildenberger and his colleagues randomly gave half the participants bird's-eye-view maps showing how sea level rise would affect their neighbourhoods. The maps were tailored to each participant so they would see a red dot highlighting where their house was relative to the flood zone.
In the end, participants who saw the flood maps ended up being less concerned about sea level rise, found the researchers. Contrary to expectations, Mildenberger said the findings held in all of the cities, both inside and outside the flood zone, and no matter where participants stood on climate science.
“We found evidence for the backlash effect,” he said.
Specific risk more effective
In a second part of the study, the researchers tried to understand why the maps prompted a psychological backlash against future projections of climate change.
Going back to San Francisco, Mildenberger and his colleagues leaned on a commuting model that uses cellphone data to track traffic movements around the city.
They then layered future flood projections on top of roads and highways to simulate how sea level rise would increase commute times up to 20 minutes longer in some neighbourhoods.
“We found that that information significantly increased people's concerns about the impact of climate change on themselves,” said Mildenberger.​

​The results show that people often struggle to digest threats from climate change when that risk is presented as something that one day, 75 years from now, might lead to a flooded basement, said Mildenberger. What’s needed, said the researcher, are specific examples that show how and to what degree their lives will be impacted.
“Even if these bird's-eye maps feel like a really elegant way to make salient future risk, they may be too abstract,” he said. “They're not actually encouraging people to think in a concrete, tangible way about all of the various impacts of sea level rise on their communities. In fact, it may be distracting them.”
Mildenberger said because the results were so consistent across different U.S. cities, he strongly suspects similar reactions in coastal towns and cities across Canada, including British Columbia.
Maps still valuable to 'power users'
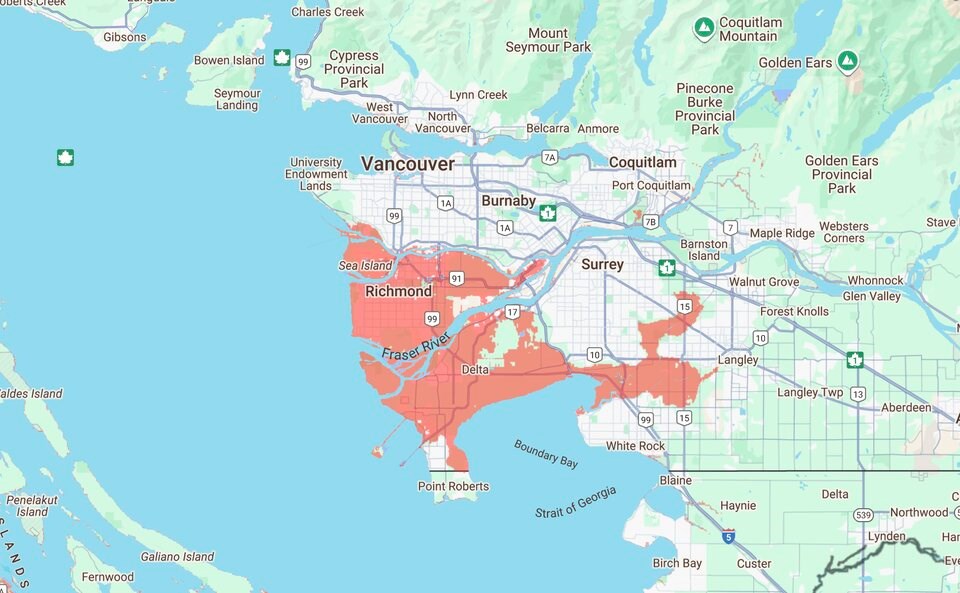
In Canada, Metro Â鶹´«Ã½Ó³»is a hot spot for flood risk. Part of that is because of high property values — nearly $30 billion in home and sits within one metre of current sea level.
Between 2070 and 2100, Metro Vancouver’s annual flood damages are expected to climb to $510 million annually, a 17-fold increase, under a low-emissions scenario; and up to $820 million annually, 27 times the current value, under a high-emissions scenario, according to a 2021 report from the Canadian Institute for Climate Choices (CICC)
That’s all expected to filter down to individual homeowners. Fifty years from now, average individual property damage is projected to hit $4,400 per year in Metro Vancouver, more than seven times today’s cost, according to the CICC report.
Yet for years, the City of Â鶹´«Ã½Ó³»— like many across the world — has used to communicate the risk faced by the city. It currently hosts a map on its website showing a one-metre rise in sea level and how it would impact shorelines in the downtown core and long swathes of waterfront along its western beaches and southern coastline.
The U.S.-based research group Climate Central, meanwhile, has put maps at the centre of its push to communicate the science of climate change to people around the world.
For years, Climate Central has released increasingly detailed showing the risk coastal flooding poses to coastal communities around the world. In many cases, their often startling maps have caught the attention of the , including Glacier Media.

Andrew Pershing, Climate Central's director of climate science, defended the value of sea level rise flood maps. He said for “power users,” including city planners and decision-makers, flood maps still act as a powerful tool, and that he doesn’t expect a “course correction” when it comes to producing them.
However, Pershing acknowledged that more needs to be done to improve the public's ability to interpret the flood maps and science behind them.
Even a light-blue shade chosen to colour water on a flood map could incorrectly suggest water is shallow and nothing to be concerned about, he said.
“I think it's really easy as scientists to assume that everybody sees these things the way that we do,” Pershing said. “Risk is just a really complicated thing for people to understand.”
More testing is needed
To move beyond maps, Climate Central has already broadened its messaging through computer rendered images of city landmarks flooded by rising seas.
Last year, the group launched a project called FloodVision, which uses LiDAR and GPS units mounted on a truck to capture photos like Google street view — only instead of a dry street, the group combines sea level rise data with artificial intelligence to present viewers with a photo-realistic waterline revealing how much a neighbourhood could flood by 2100.
“We’ll create a new paradigm to bring climate warnings home in a personal, visual way,” promises a narrator in video promoting the service.
Mildenberger said a colleague at the University of Montreal is researching similar images generated by artificial intelligence to see how effective they are.
From city governments to climate researchers, Mildenberger said everyone is trying to take the abstract risk of climate change and make it more real for ordinary people.
The problem, he said, is that until recently, few have tested what kind of messages are getting through.


