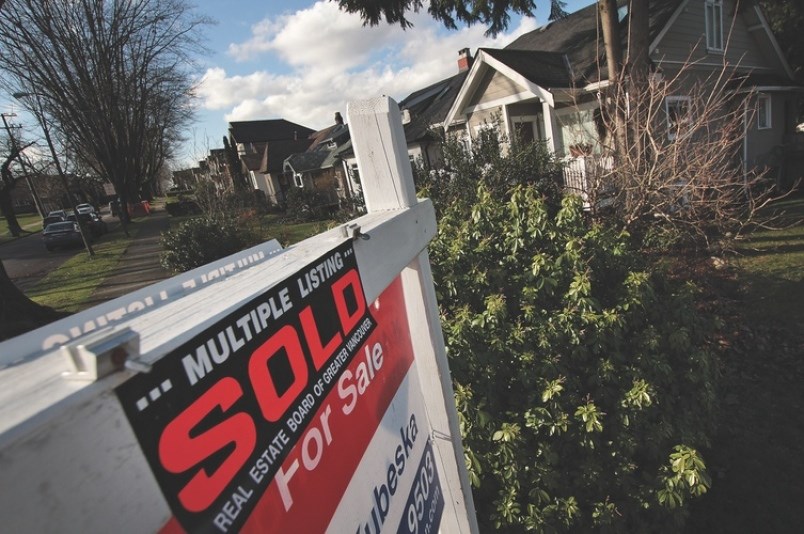
February saw steady demand from home buyers in Metro Vancouver, while the inventory of listed properties “struggled to keep pace,” according to a March 3 report by the Real Estate Board of Greater Â鶹´«Ã½Ó³»(REBGV).
There were 2,150 transactions on the residential resale market in February 2020, a 44.9 per cent rise over February 2019, and 36.9 per cent higher than the 1,571 homes sold in January 2020.
Even though February’s total sales was 15.9 per cent below the 10-year average for the month, the supply of available homes for sale was unable to meet demand.
“Home buyer demand again saw strong year-over-year increases in February while the total inventory of homes for sale struggled to keep pace,” said Ashley Smith, REBGV president. “This was most pronounced in the condominium market.”
(Story continues below)
This lack of competition increased the pressure on home prices, with the benchmark composite price of a Metro Â鶹´«Ã½Ó³»home rising slightly again last month. The benchmark price for all residential properties combined, across the region, now stands at $1,020,600, which is a 0.3 per cent increase over February 2019 and a 2.7 per cent increase over the past six months.
(Story continues below)
Although new listings in February were 3.4 per cent higher than in January, the total number of homes for sale as of the end of February was 20.7 per cent lower than the same month last year, at 9,195 units.
The sales-to-active listings ratio in February 2020 was 23.4 per cent. It is deemed to be a seller’s market if the measure is more than 20 per cent for several consecutive months. By property type, the ratio is 17.3 per cent for detached homes (a balanced market), 26.9 per cent for townhomes, and 28.4 per cent for apartments (both now seller’s markets).
Smith added, “Our Realtors are reporting increased traffic at open houses and multiple offer scenarios in certain pockets of the market. If you’re considering listing your home for sale, now is a good time to act with increased demand, reduced competition from other sellers, and some upward pressure on prices.”
Sales and prices by property type and area
Although detached homes in Metro Â鶹´«Ã½Ó³»saw the lowest sales-to-listings ratio, it was the submarket to see the most rapid sales growth in February. There were 685 single-family home sales across the region last month, which is a jump of 52.9 per cent year over year.
The benchmark price for a detached Metro Â鶹´«Ã½Ó³»house has not recovered its recent losses yet, but it is recovering. The benchmark price for a detached home in the region is now $1,433,900. This is 0.7 per cent lower than in February 2019 but a 1.9 per cent increase compared with the low point seen around six months ago.
Whistler and Squamish were again the markets to see the biggest annual jump in typical detached home values, up 15.7 per cent and 10.1 per cent respectively. The steepest price loss in the REBGV’s jurisdiction was seen in Bowen Island, where typical detached prices are down 8.4 per cent year over year, followed by the Sunshine Coast, down 7.8 per cent.
Sales of attached Metro Â鶹´«Ã½Ó³»homes such as townhouses and duplexes totalled 404 in February, a 45.8 per cent increase compared with the 277 sales in February 2019.
A typical attached home in the region now sells for $785,000, according to the board. This is 0.6 per cent higher than in February 2019 and a 1.7 per cent increase over the past six months.
As with detached homes, Whistler and Squamish townhome prices have seen the biggest increases in the region, up 7.5 and 7.2 per cent respectively. Once again, resale townhome prices in Ladner (down 5.0 per cent) and Tsawwassen (down 4.5 per cent) dropped the most year over year, although those declines are not as steep as they have been recently.
Some 1,061 Metro Â鶹´«Ã½Ó³»condos traded on the MLS last month, which is a 39.8 per cent increase over the 759 sales in February 2019.
With the demand for condos highest of all the property types, and supply not keeping up, the price of a typical Metro Â鶹´«Ã½Ó³»condo has recovered the most so far. The benchmark price of an apartment property now stands at $677,200, which is 0.9 per cent higher than in February 2019 and a 3.6 per cent increase over the past six months.
Surprisingly, given the rise in detached and townhome prices in the area, Squamish condos saw the region’s biggest annual condo price drops, down 6.8 per cent. Port Moody and Coquitlam were the areas with the biggest benchmark condo price rises, up four and three per cent year over year respectively.
Home prices vary widely in different areas throughout the region. To get a good idea of home prices in a specific Metro Â鶹´«Ã½Ó³»location and by property type, check the detailed MLS® Home Price Index in the full .


