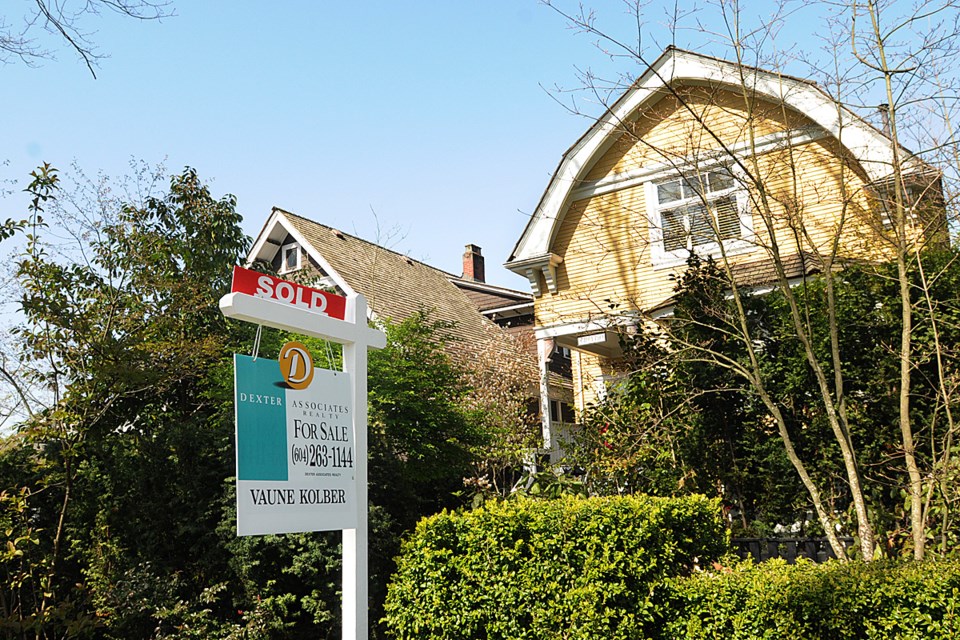
Home prices across Metro Â鶹´«Ã½Ó³»are continuing to slide, reported the Real Estate Board of Greater Â鶹´«Ã½Ó³»(REBGV) May 2.
The board said that the composite benchmark home price across Metro Â鶹´«Ã½Ó³»dipped to $1,008,400 in April, very close to edging back down over the million-dollar mark. This is 8.5 per cent decrease over April 2018’s price, and a 0.3 per cent decline from March 2019.
Home inventory is piling up as the number of new listings met usual market levels but sales dropped on an annual basis. The number of Metro Â鶹´«Ã½Ó³»homes to exchange hands on the MLS in April was 1,829, a 29.1 per cent drop from April 2018. However, this was a 5.9 per cent increase from the 1,727 homes sold in March this year.
April’s sales total was 43.1 per cent below the 10-year April sales average (see interactive graph, below), which is a slight improvement over the dire figures seen the previous month.
The REBGV continued its stance in placing the blame for reduced home sales at the federal government’s door. Ashley Smith, REBGV president, said, “Government policy continues to hinder home sale activity. The federal government’s mortgage stress test has reduced buyers’ purchasing power by about 20 per cent, which is causing people at the entry-level side of the market to struggle to secure financing.”
She added, “Suppressing housing activity through government policy not only reduces home sales, it harms the job market, economic growth and creates pent-up demand.”
The board said that new home listing activity was normal for the spring season. There were 5,742 homes listed for sale on MLS in Metro Â鶹´«Ã½Ó³»in April 2019. This is 1.3 per cent lower than in April 2018 but up 16 per cent increase compared with March 2019.
However, the sluggish sales meant that total inventory is accumulating. The total number of Metro Â鶹´«Ã½Ó³»homes listed for sale is 14,357, which is a 46.2 per cent increase compared with April 2018 and a 12.4 per cent increase compared to March 2019.
“There are more homes for sale in our market today than we’ve seen since October 2014. This trend is more about reduced demand than increased supply,” Smith said. “The number of new listings coming on the market each month are consistent with our long-term averages. It’s the reduced sales activity that’s allowing listings to accumulate.”
Across all property types combined, the sales-to-active listings ratio for April 2019 is 12.7 per cent, which is the low end of a balanced market, edging closer to a buyer’s market. By property type, the ratio is 9.4 per cent for detached homes (firmly a buyer’s market), 15.4 per cent for townhomes and 15.3 per cent for condos (both balanced markets).
Sales and prices by property type and area
Just 586 Metro Â鶹´«Ã½Ó³»detached homes traded hands in April, which is a 27.4 per cent year over year decline, but a 10.8 per cent rise compared with March this year.
The benchmark price for a detached home in the region is $1,425,200, which is 11.1 per cent lower than April 2018, and a 0.8 per cent decrease from March 2019.
As has been the recent trend, West Â鶹´«Ã½Ó³»saw the steepest year-over-year declines in benchmark detached home prices, down 15.7 per cent, followed by Â鶹´«Ã½Ó³»West (-13.4 per cent), Burnaby North (-12.8 per cent) and Richmond (-12.3 per cent).
All 20 MLS areas in the board’s jurisdiction posted an annual slide in detached benchmark prices, including Bowen Island and the Sunshine Coast, which had resisted the market downturn but in April posted slight price drops of 0.2 and 0.5 per cent respectively.
Sales of Metro Â鶹´«Ã½Ó³»attached homes such as townhouses, duplexes and rowhomes totalled 358 in April, down 22.8 per cent year over year but up 10.2 per cent month over month.
A typical attached home price is now pegged at $783,300, which is the same as last month and 6.9 per cent lower than in April 2018.
Once again, benchmark attached home prices fell by the largest percentage on an annual basis in Â鶹´«Ã½Ó³»East (East Side and Downtown East), 12.5 per cent lower than a year ago, followed by Tsawwassen (-12.9 per cent), Port Coquitlam (-10.5 per cent) and Â鶹´«Ã½Ó³»West (-10.3 per cent). Like detached homes, attached home prices fell in all Metro Â鶹´«Ã½Ó³»areas, but saw the least-steep declines in Port Moody (-0.2 per cent) and New Westminster (-4.1 per cent).
Sales of condos across the region totalled 885 in April 2019, a 32.3 per cent decrease compared with April 2018 and just 13 units more than in March this year (up 1.3 per cent).
The benchmark price of a Metro Â鶹´«Ã½Ó³»condo is now pegged at $656,900. This is a 6.9 per cent decrease from April 2018 and, like townhouses, is unchanged from March.
Yet again, West Â鶹´«Ã½Ó³»condos fell by the highest proportion, with a typical condo in the municipality pegged at 12.9 per cent less than the same month last year. The two other areas to see a double-digit condo price drop were Whistler, down 10.9 per cent year over year, and Pitt Meadows, down (10.4 per cent). As with the other home types, all areas in the REBGV region saw condo prices lower than one year ago, with the least-steep declines seen in Burnaby North (-4.5 per cent) and Â鶹´«Ã½Ó³»East (-4.7 per cent).
Home prices vary widely in different areas throughout the region. To get a good idea of home prices in a specific location and by property type, check the detailed MLS® Home Price Index in the .


