It’s been fascinating to see the range of opinions on the Erik Gudbranson trade. From a Canucks perspective, it’s been called everything from “” to a “”.
In general, the opinions on the trade have split along party lines. It was NBC’s Pierre McGuire, an , who called it a home run for the Canucks and it was TSN’s Travis Yost, an , who called it inexplicable.
The truth likely falls somewhere in between those two extremes. Gudbranson’s corsi and other shot-based statistics are bad—there’s no denying that—but as I wrote on Tuesday, that should give Canucks fans reason to be cautiously optimistic.
There were some elements of Gudbranson’s analytics that I wasn’t able to fit into that post, so let's take a deeper dive into the fancy stat pool.
Let’s start with an that got brought up frequently in the wake of the trade. It was from last September and talked about Gudbranson’s first four seasons with the Panthers and his expectations for the coming season.
The part that got a lot of attention, however, was where the article attempted to put a positive spin on Gudbranson’s analytics and many Canucks fans linked to it as evidence that his fancy stats were not as bad as people were saying.
Gudbranson had a zone start adjusted icorsi/60 of 9.92 last season, meaning that despite his defensively skewed usage, he was still having a positive impact on possession play.
What you see is obvious: Gudbranson did very well possession metric-wise despite heavily tilted defensive zone play, and is in fact nipping at the heels of Roman Josi in this department.
This all sounds great. It sounds like if you adjust for zone starts, then Gudbranson’s possession statistics are really, really good. The problem is that this is completely and utterly wrong.
The issue is that iCorsi is not a possession statistic: it’s simply how many shots the individual player attempts. In the 2014-15 season, Gudbranson individually had 9.92 shot attempts per 60 minutes of ice time. It has nothing to do with the rest of the team when he was on the ice and doesn’t even include any shot attempts against.
All that Gudbranson’s high iCorsi means is that he takes a high number of shot attempts himself, which squares up with the scouting reports that he’s an indiscriminate shooter when he gets in the offensive zone and not a good passer.
His actual zone start adjusted corsi from 2014-15 (courtesy of , which is where I assume LBC got the iCorsi stats), is 49.9%, which isn't all that bad, but it was fifth on the Panthers, which paints a very different picture than his team-leading iCorsi. This past season, Gudbranson's zone start adjusted corsi was 46.8%, which is significantly worse and better than only Willie Mitchell on the Panthers. That might play into the argument that Mitchell dragged him down this season.
One defence for Gudbranson’s poor possession numbers that I’ve seen is that he simply never saw the offensive zone. I’m going to again reference Litter Box Cats, from :
It’s hard to put up possession numbers when every time you move a puck up in transition to offense you are swapped out. It was rare to see Gudbranson in the offensive zone. Instead, it was always him duking it out with the opponent’s top line and once transition began, he changed for a more offensive D-man.
It’s not an outrageous claim that a player could be sent out to play almost exclusively in the defensive zone. We’ve seen a player in Â鶹´«Ă˝Ół»who was used this way: Manny Malhotra used to come out for defensive zone faceoffs, then immediately change for another centre as soon as the Canucks got the puck out.
There is evidence for this type of usage for Malhotra, though: his shift length. In 2011-12, when his usage was most extreme, .
If Gudbranson really did frequently get off the ice as soon as the puck left the defensive zone, then he should have taken shorter shifts than the average defenceman, particularly if he was good at efficiently defending his end of the ice.
Unfortunately, that’s not the case. In fact, he’s in the top 20 in the NHL for longest shifts among defencemen last season. That’s not necessarily a bad thing, but it puts to lie the idea that he regularly jumped off the ice as soon as the puck entered the offensive zone.
Or, if it’s true that he rarely saw the offensive zone and went to the bench as soon as the puck moved up ice, then he was stuck in the defensive zone for really, really long periods of time. Which is bad.
What it really seems to mean is that Gudbranson just doesn’t have much offence to his game. His shifts were long enough that he could have had an impact at the offensive end of the ice, but he just didn’t. There’s room for that type of player, of course. Chris Tanev, for instance, is not offensively inclined and we like him just fine.
The difference between Tanev and Gudbranson, however, is that Tanev is elite when it comes to shot suppression. He , meaning that compared to the rest of the Canucks, Tanev was absolutely incredible. Sure, you could argue that the lousiness of some of his teammates make his relative numbers look better, but it’s still clear that Tanev is brilliant at preventing shots.
Gudbranson, on the other hand, is at the other end of the spectrum. Among defencemen who played at least 400 minutes last season, Gudbranson was . The only reason I don’t despair at that number is that the second worst is Willie Mitchell, who was frequently Gudbranson’s defence partner, and it’s possible that Gudbranson might improve away from Mitchell.
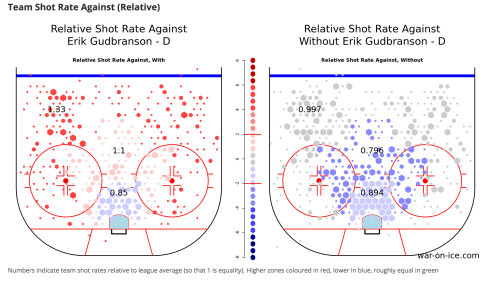
That said, where were all those shots coming from when Gudbranson was on the ice? Let’s take a look at a heat map from the now-defunct War-on-Ice.com to see.

This chart seems to support the idea that Gudbranson is a crease-clearer, as a lower-than-league-average number of shots came from directly in front of the net when Gudbranson was on the ice. On the right side, you can see that the Panthers in general allowed fewer shots from that area, though Gudbranson still allowed fewer.
Shots from the high slot were just a little above league average for Gudbranson and much higher than the Panthers’ average, and he allowed a much greater number of shots from the outside, with most of them coming from the right point, opposite from the side he played.
It’s interesting to note that this appeared to be the Panthers’ gameplan: force shots away from Luongo’s weaker blocker side and towards his stronger glove side. Gudbranson, as a right-side defenceman, .
It’s still troubling how many shots were given up with Gudbranson on the ice, but seeing where those shots came from gives us a little more context.
Finally, let’s look at one last metric before putting Gudbranson’s analytics to bed for a while: dCorsi. This statistic created by Stephen Burtch uses a formula to find the average corsi for a given player’s usage, then compares it to the actual corsi for that player.

War-on-Ice stopped updating the dCorsi page partway through last season, so it only includes the first 44 games from the 2015-16 season. That covers the entire time he was paired with Willie Mitchell incidentally and only a portion of the time he played with Brian Campbell, with whom he posted much better possession numbers.
In any case, we can see from dCorsi that Gudbranson actually had a positive impact on puck possession in three out of his five season with the Panthers, though that impact was entirely on the offensive side of the ice.
In all five seasons, the Panthers had more shot attempts against with Gudbranson on the ice than you would expect from an average defenceman with his usage, but had more shot attempts for than expected. Surprisingly, Gudbranson might have more impact offensively than his measly point totals might suggest.
This past season was his worst in terms of dCorsi, but his previous seasons and performance last season away from Willie Mitchell mean he could be better with the Canucks.
Ěý


