British Columbians will have access to detailed data related to coronavirus (COVID-19) in communities starting this week.
The Province will provide information on case rates and immunization by community health service area starting Wednesday (May 12) on the BC Centre for Disease Control (BCCDC) website with its weekly updated surveillance data.
So far, the BCCDC has only provided information for local health areas, rather than at the community level.
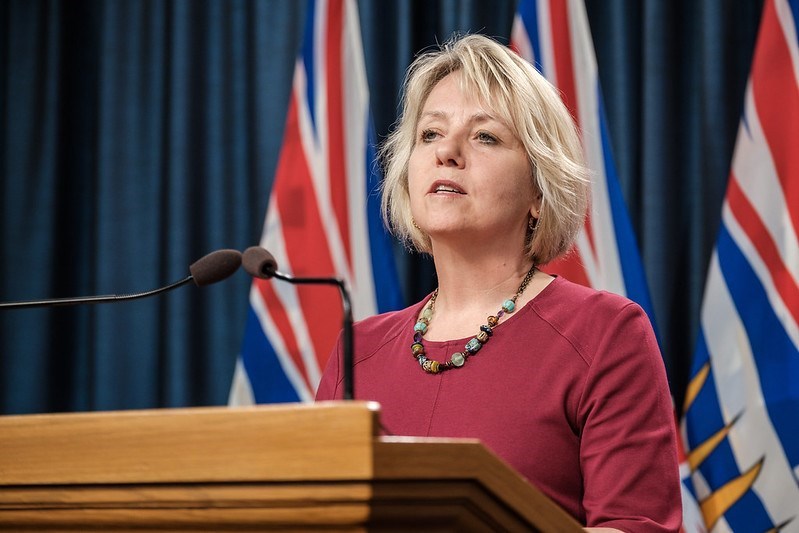
Provincial Health Officer Dr. Bonnie Henry told reporters in the daily coronavirus (COVID-19) briefing Monday (May 10) that information on case and immunization rates in community health service areas will be available in maps starting this week.
"You'll be able to look at more granular detail by mostly community health service area - and I say mostly because there are some smaller population centres in the province, mostly rural ones where we only can present by local health area, because the community, and parts of the community can be identifiable," she said.
For now, the information will be presented in "static" maps, but Henry stated that health officials "have been working on developing an interactive mapping app so that you can actually look at different neighbourhoods, by both age and sex and that will also be available in the coming days."
Henry added that the community health service area maps will be updated regularly.
Other types of information - including race-based data, disaggregated data based on race, workplace data, and school data - may not be included in B.C.'s ongoing systematic surveillance, noted Henry. Instead, health officials present these kinds of information at the monthly modelling meetings.
Henry also encouraged British Columbians to visit the , which is an interactive tool that visualizes the COVID-19 epidemiology in B.C. in comparison to other Canadian and global jurisdictions.
Henry defends B.C.'s data-release procedures
Last week, Henry promised to start releasing more neighbourhood-specific data after leaked BCCDC documents showed health officials in B.C. have been withholding detailed data from the public.
Henry defended the province's procedures before she yielded and promised to release more data.
"We do release almost all of that information that within some of the reports that were posted," Henry said. "It comes out in various different forms."
The BCCDC's weekly reports, however, are about four times as long as those made public in B.C., and they contain a much deeper breakdown of how variants of concern are spreading. The reports have also noted the risk to B.C., given that neighbour Alberta has been enduring the highest per-capita infection rate in the country.
With files from Glen Korstrom/Glacier Media


